") 從零入門Prometheus:構(gòu)建企業(yè)級監(jiān)控與報警系統(tǒng)的最佳實踐指南
從零入門Prometheus:構(gòu)建企業(yè)級監(jiān)控與報警系統(tǒng)的最佳實踐指南
測試環(huán)境
prometheus-2.26.0.linux-amd64.tar.gz
下載地址:https://github.com/prometheus/prometheus/releases/download/v2.26.0/prometheus-2.26.0.linux-amd64.tar.gz
prometheus-2.54.1.linux-amd64.tar.gz
下載地址:https://github.com/prometheus/prometheus/releases/download/v2.26.0/prometheus-2.26.0.linux-amd64.tar.gz
CentOS 7.9
下載并運行Prometheus
# wget https://github.com/prometheus/prometheus/releases/download/v2.26.0/prometheus-2.26.0.linux-amd64.tar.gz
# tar xvzf prometheus-2.26.0.linux-amd64.tar.gz
# cd prometheus-2.26.0.linux-amd64
# ls
console_libraries  consoles  LICENSE  NOTICE  prometheus  prometheus.yml  promtool
開始運行之前,先對它進(jìn)行配置。
配置Prometheus自身監(jiān)控
Prometheus通過抓取度量HTTP端點來從目標(biāo)收集指標(biāo)。由于Prometheus以同樣的方式暴露自己的數(shù)據(jù),它也可以搜集和監(jiān)控自己的健康狀況。
雖然只收集自身數(shù)據(jù)的Prometheus服務(wù)器不是很有用,但它是一個很好的開始示例。保存以下Prometheus基礎(chǔ)配置到一個名為prometheus.yml的文件(安裝包自動解壓后,解壓目錄下,默認(rèn)就就有一個名為prometheus.yml的文件)
global:
  scrape_interval:     15s # 默認(rèn),每15秒采樣一次目標(biāo)

  # 與其它外部系統(tǒng)(比如federation, remote storage, Alertmanager)交互時,會附加這些標(biāo)簽到時序數(shù)據(jù)或者報警
  external_labels:
    monitor: 'codelab-monitor'

# 一份采樣配置僅包含一個 endpoint 來做采樣
# 下面是 Prometheus 本身的endpoint:
scrape_configs:
  # job_name 將被被當(dāng)作一個標(biāo)簽 `job=`添加到該配置的任意時序采樣.
  - job_name: 'prometheus'

    # 覆蓋全局默認(rèn)值,從該job每5秒對目標(biāo)采樣一次
    scrape_interval: 5s

    static_configs:
      # 如果需要遠(yuǎn)程訪問, localhost  也可以替換為具體IP,比如10.118.71.170
      - targets: ['localhost:9090']
有關(guān)配置選項的完整說明,請參閱配置文檔。
啟動Prometheus
使用新創(chuàng)建的配置文件來啟動 Prometheus,切換到包含 Prometheus 二進(jìn)制文件的目錄并運行
# 啟動 Prometheus.
# 默認(rèn)地, Prometheus 在 ./data 路徑下存儲其數(shù)據(jù)庫 (flag --storage.tsdb.path).
# ./prometheus --config.file=prometheus.yml
通過訪問localhost:9000來瀏覽狀態(tài)頁。等待幾秒讓他從自己的 HTTP metric endpoint 來收集數(shù)據(jù)。
還可以通過訪問到其 metrics endpoint(http://localhost:9090/metrics)來驗證 Prometheus 是否正在提供有關(guān)其自身的 metrics
開放防火墻端口
# firewall-cmd --permanent --zone=public --add-port=9090/tcp
success
# firewall-cmd --reload
success
使用expressin browser
使用 Prometheus 內(nèi)置的expressin browser訪問localhost:9090/graph,選擇Graph導(dǎo)航菜單下的Tabletab頁 (Classic UI下為Consoletab頁)。
通過查看localhost:9090/metrics頁面內(nèi)容可知,Prometheus 導(dǎo)出了關(guān)于其自身的一個名為prometheus_target_interval_length_seconds指標(biāo)(目標(biāo)采樣之間的實際間隔)。將其作為搜索表達(dá)式,輸入到表達(dá)式搜索框中,點擊Execute按鈕,如下,將返回多個不同的時間序列(以及每個時間序列的最新值),所有時間序列的 metric 名稱均為prometheus_target_interval_length_seconds,但具有不同的標(biāo)簽。這些標(biāo)簽具有不同的延遲百分比和目標(biāo)組間隔(target group intervals)。
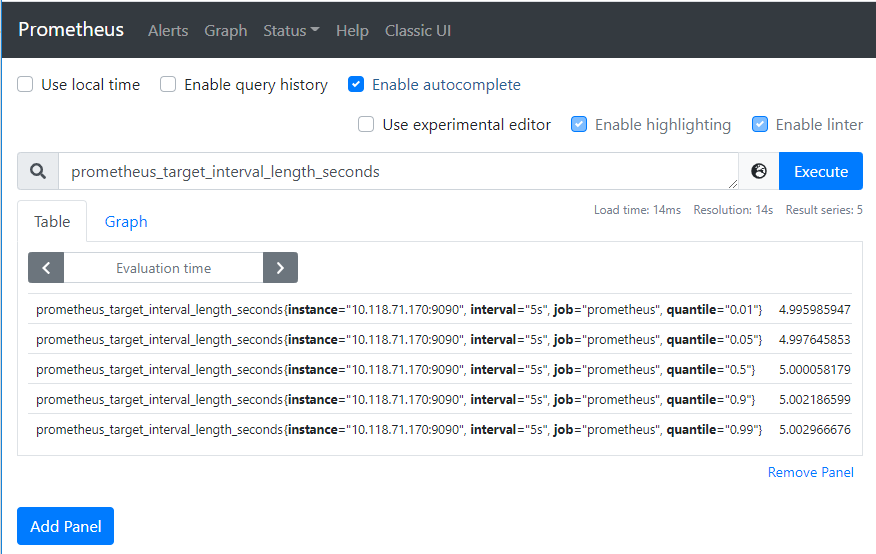
如果我們只對第 99 個百分位延遲感興趣,則可以使用以下查詢來檢索該信息:
prometheus_target_interval_length_seconds{quantile="0.99"}
如果需要計算返回的時間序列數(shù),可以修改查詢?nèi)缦拢?/p>
count(prometheus_target_interval_length_seconds)
更多有關(guān) expression language 的更多信息,請查看 expression language 文檔。
使用繪圖界面
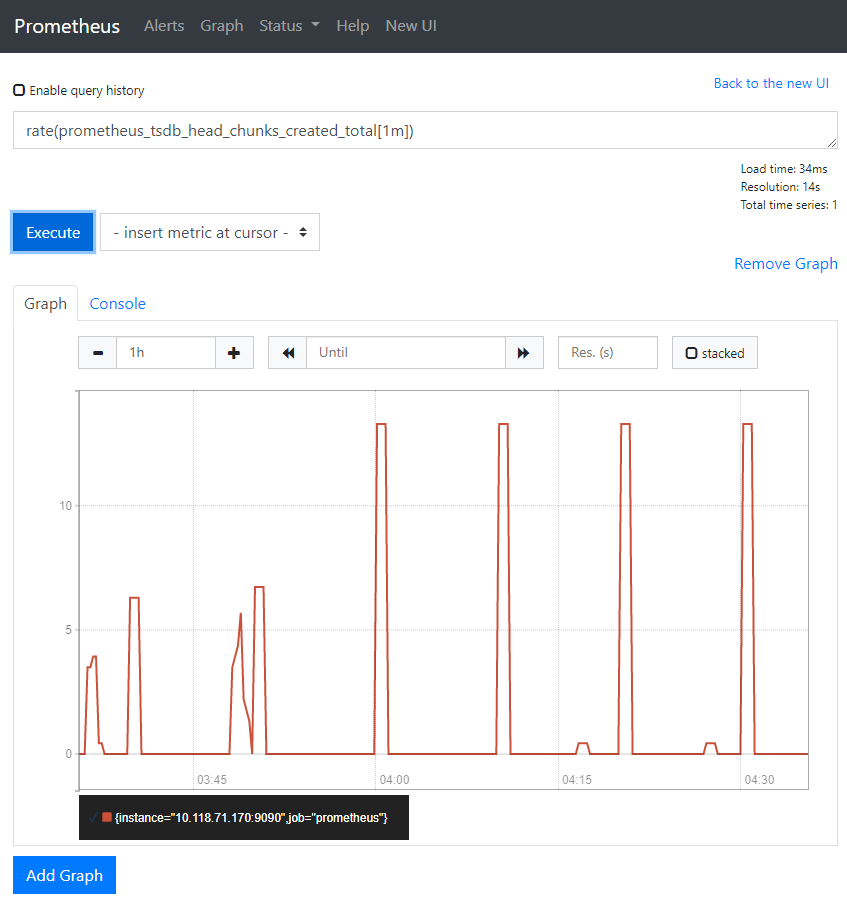
要繪制圖形表達(dá)式,請使用 “Graph” 選項卡。
例如,輸入以下表達(dá)式以繪制在自采樣的 Prometheus 中每秒創(chuàng)建 chunk 的速率:
rate(prometheus_tsdb_head_chunks_created_total[1m])
啟動一些采樣目標(biāo)
現(xiàn)在讓我們增加一些采樣目標(biāo)供 Prometheus 進(jìn)行采樣。
使用Node Exporter作為采樣目標(biāo),多關(guān)于它的使用請查閱
# wget https://github.com/prometheus/node_exporter/releases/download/v1.1.2/node_exporter-1.1.2.linux-amd64.tar.gz
# tar -xvzf node_exporter-1.1.2.linux-amd64.tar.gz
# ./node_exporter --web.listen-address 127.0.0.1:8001
# ./node_exporter --web.listen-address 127.0.0.1:8002
# ./node_exporter --web.listen-address 127.0.0.1:8003
現(xiàn)在,應(yīng)該存在監(jiān)聽http://localhost:8080/metrics, http://localhost:8081/metrics 和http://localhost:8082/metrics的示例目標(biāo)
配置 Prometheus 來監(jiān)控示例目標(biāo)
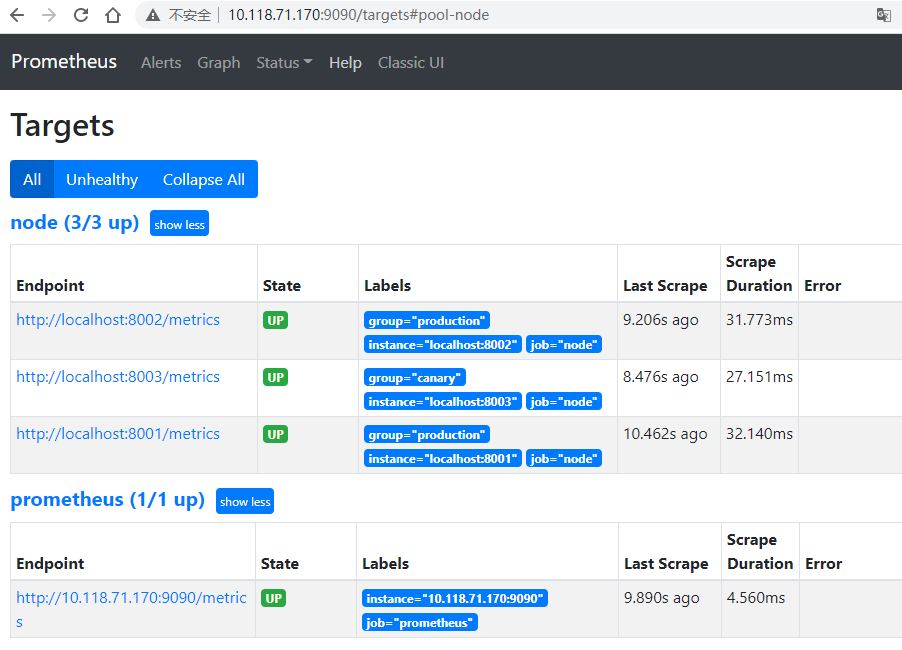
現(xiàn)在,我們將配置 Prometheus 來采樣這些新目標(biāo)。讓我們將所有三個 endpoint 分組為一個稱為 “node” 的 job。但是,假設(shè)前兩個 endpoint 是生產(chǎn)目標(biāo),而第三個 endpoint 代表金絲雀實例。為了在 Prometheus 中對此建模,我們可以將多個端組添加到單個 job 中,并為每個目標(biāo)組添加額外的標(biāo)簽。在此示例中,我們將group=“ production”標(biāo)簽添加到第一個目標(biāo)組,同時將group=“ canary”添加到第二個目標(biāo)。
為此,請將以下job定義添加到prometheus.yml中的scrape_configs部分,然后重新啟動 Prometheus 實例。修改后的prometheus.yml內(nèi)容如下
global:
  scrape_interval:     15s # 默認(rèn),每15秒采樣一次目標(biāo)

  # 與其它外部系統(tǒng)(比如federation, remote storage, Alertmanager)交互時,會附加這些標(biāo)簽到時序數(shù)據(jù)或者報警
  external_labels:
    monitor: 'codelab-monitor'

# 一份采樣配置僅包含一個 endpoint 來做采樣
# 下面是 Prometheus 本身的endpoint:
scrape_configs:
  # job_name 將被被當(dāng)作一個標(biāo)簽 `job=`添加到該配置的任意時序采樣.
  - job_name: 'prometheus'

    # 覆蓋全局默認(rèn)值,從該job每5秒對目標(biāo)采樣一次
    scrape_interval: 5s

    static_configs:
      - targets: ['10.118.71.170:9090']

  - job_name: 'node'

    # Override the global default and scrape targets from this job every 5 seconds.
    scrape_interval: 5s

    static_configs:
      - targets: ['localhost:8001', 'localhost:8002']
        labels:
          group: 'production'

      - targets: ['localhost:8003']
        labels:
          group: 'canary'
查看Targets(Status->Targets)
Graph查詢
配置規(guī)則以將采樣的數(shù)據(jù)聚合到新的時間序列
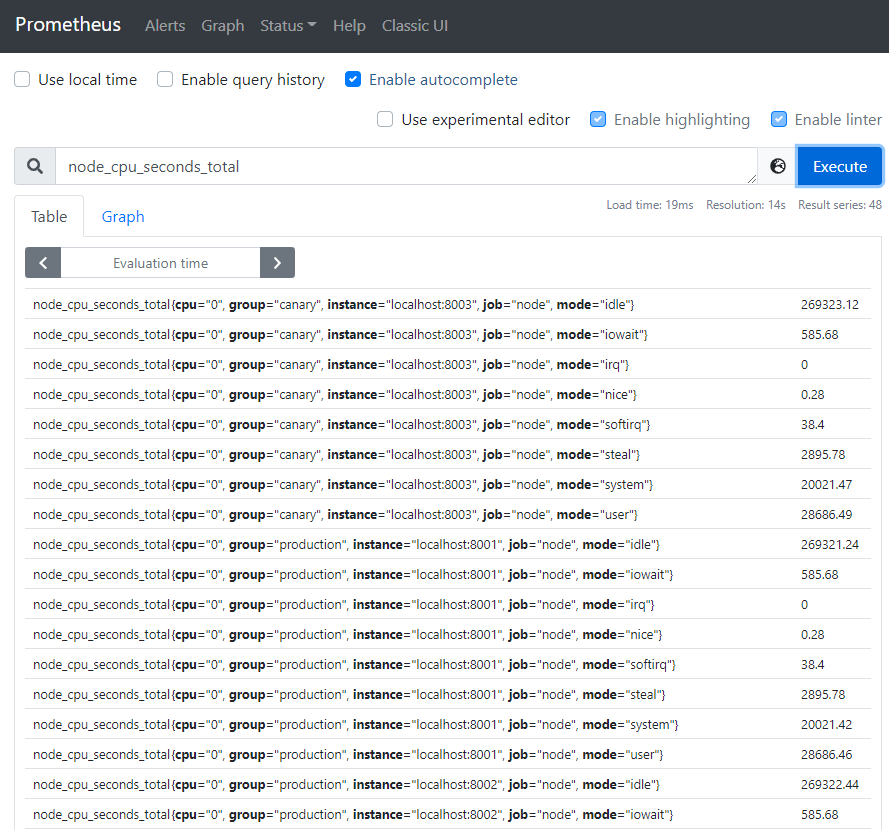
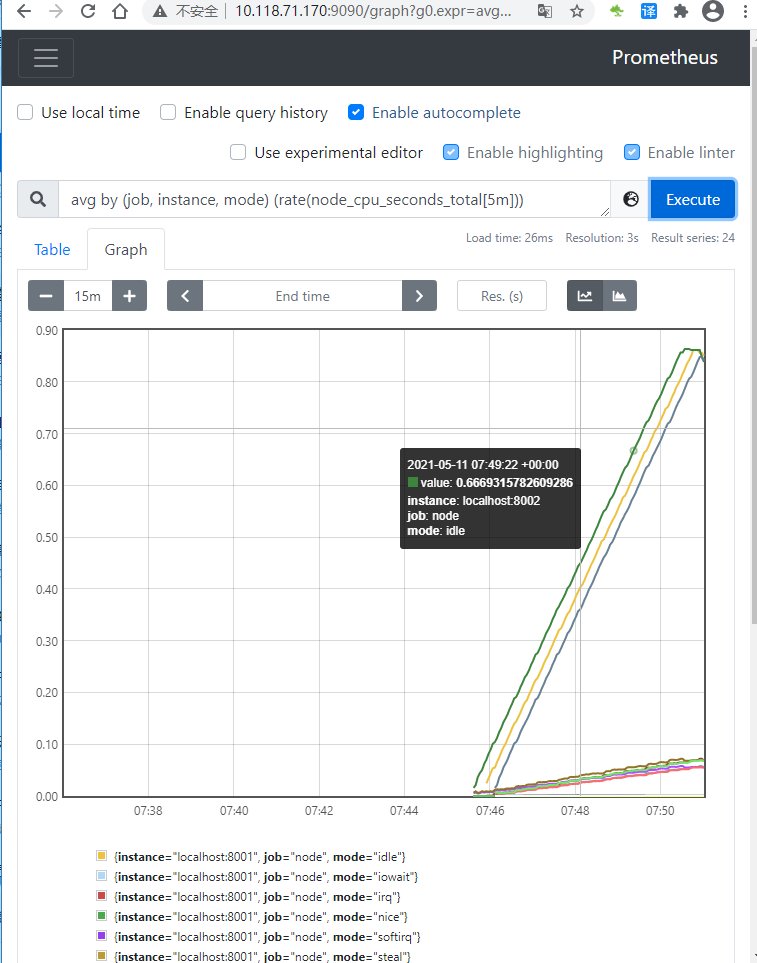
盡管在我們的示例中并不會有問題,但是在聚集了數(shù)千個時間序列中查詢時可能會變慢。為了提高效率,Prometheus 允許通過配置的記錄規(guī)則將表達(dá)式預(yù)記錄到全新的持久化的時間序列中。假設(shè)我們感興趣的是 5 分鐘的窗口內(nèi)測得的每個實例的所有cpu上平均的cpu時間(node_cpu_seconds_total,保留 Job,instance,和mode 維度))。我們可以這樣寫:
avg by (job, instance, mode) (rate(node_cpu_seconds_total[5m]))
Graph中執(zhí)行查詢,結(jié)果如下
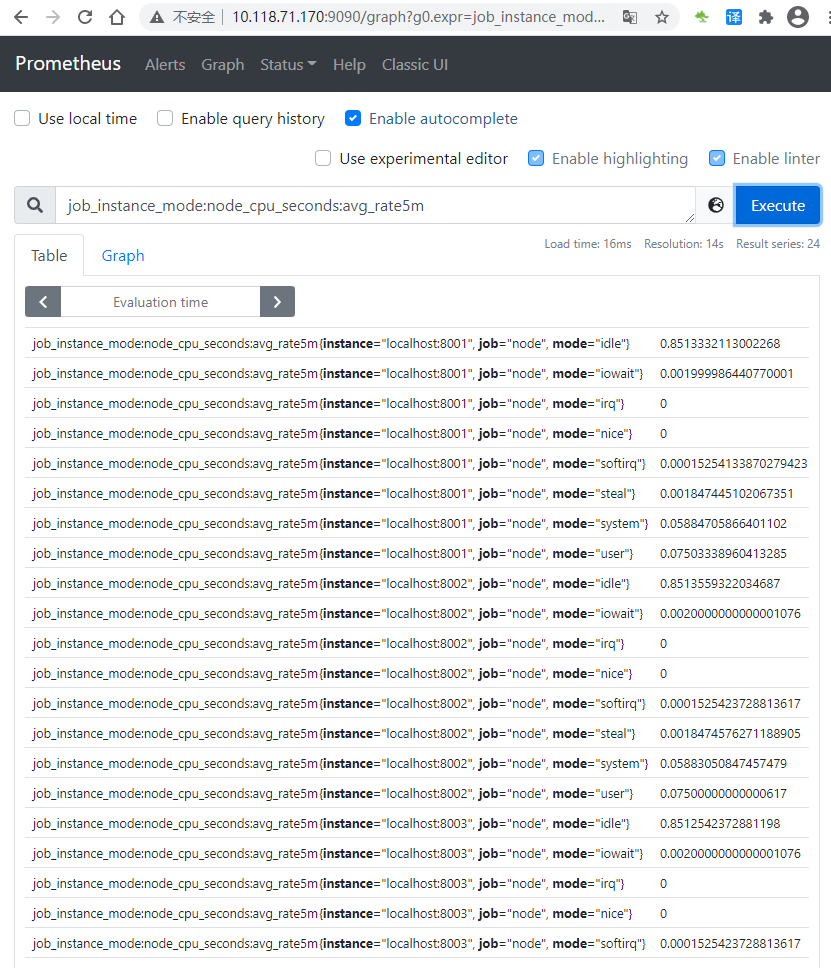
現(xiàn)在,要將由該表達(dá)式產(chǎn)生的時間序列記錄到一個名為:job_instance_modeavg_rate5m的新指標(biāo),使用以下記錄規(guī)則創(chuàng)建文件并將其保存prometheus.rules.yml
groups:
- name: cpu-node
  rules:
  - record: job_instance_modeavg_rate5m
    expr: avg by (job, instance, mode) (rate(node_cpu_seconds_total[5m]))
在prometheus.yml中添加rule_files語句,以便 Prometheus 選擇此新規(guī)則。現(xiàn)在,prometheus.yml配置應(yīng)如下所示:
global:
  scrape_interval:     15s # 默認(rèn),每15秒采樣一次目標(biāo)

  # 與其它外部系統(tǒng)(比如federation, remote storage, Alertmanager)交互時,會附加這些標(biāo)簽到時序數(shù)據(jù)或者報警
  external_labels:
    monitor: 'codelab-monitor'

rule_files:
  - 'prometheus.rules.yml'

# 一份采樣配置僅包含一個 endpoint 來做采樣
# 下面是 Prometheus 本身的endpoint:
scrape_configs:
  # job_name 將被被當(dāng)作一個標(biāo)簽 `job=`添加到該配置的任意時序采樣.
  - job_name: 'prometheus'

    # 覆蓋全局默認(rèn)值,從該job每5秒對目標(biāo)采樣一次
    scrape_interval: 5s

    static_configs:
      - targets: ['10.118.71.170:9090']

  - job_name: 'node'

    # Override the global default and scrape targets from this job every 5 seconds.
    scrape_interval: 5s

    static_configs:
      - targets: ['localhost:8001', 'localhost:8002']
        labels:
          group: 'production'

      - targets: ['localhost:8003']
        labels:
          group: 'canary'
通過新的配置重新啟動 Prometheus,并通過expression brower查詢job_instance_modeavg_rate5m,結(jié)果如下
鏈接:https://www.cnblogs.com/shouke/p/18667439
-
監(jiān)控
+關(guān)注
關(guān)注
6文章
2307瀏覽量
56538 -
Prometheus
+關(guān)注
關(guān)注
0文章
29瀏覽量
1839
原文標(biāo)題:從零開始掌握Prometheus:企業(yè)級監(jiān)控與報警系統(tǒng)的最佳實踐
文章出處:【微信號:magedu-Linux,微信公眾號:馬哥Linux運維】歡迎添加關(guān)注!文章轉(zhuǎn)載請注明出處。
發(fā)布評論請先 登錄
Prometheus的架構(gòu)原理從“監(jiān)控”談起
Prometheus的基本原理與開發(fā)指南

SAS走進(jìn)企業(yè)級存儲應(yīng)用
采用nvSRAM確保企業(yè)級SSD故障時電源可靠性
prometheus做監(jiān)控服務(wù)的整個流程介紹
戴爾“企業(yè)級”視頻監(jiān)控解決方案


 工商網(wǎng)監(jiān)
評論