") Pandas:Python中最好的數(shù)據(jù)分析工具
Pandas:Python中最好的數(shù)據(jù)分析工具

Pandas絕對是Python中最好的數(shù)據(jù)分析工具,不接受反駁。
本文將展示如何美化 Pandas DataFrame 中的數(shù)字,并使用一些更高級的 Pandas 樣式可視化選項(xiàng),來提高您使用 Pandas 分析數(shù)據(jù)的能力。
常見的比如說:
- 在處理貨幣值時(shí)使用貨幣符號。例如,如果您的數(shù)據(jù)包含值 25.00,您不會(huì)立即知道該值是人民幣、美元、英鎊還是其他某種貨幣。
- 百分比是另一個(gè)有用的示,0.05 或 5%?使用百分比符號可以非常清楚地了解如何解釋數(shù)據(jù)。
- Pandas 樣式還包括更高級的工具,用于向輸出添加顏色或其他視覺元素。
案例分析
本文將使用一個(gè)虛擬數(shù)據(jù),為大家進(jìn)行講解。該數(shù)據(jù)是一個(gè)虛構(gòu)組織的2018 年銷售數(shù)據(jù)。
數(shù)據(jù)集鏈接如下:
https://www.aliyundrive.com/s/Tu9zBN2x81c
1. 導(dǎo)入相關(guān)庫,并讀取數(shù)據(jù)
import numpy as np
import pandas as pd

df = pd.read_excel('2018_Sales_Total.xlsx')
效果如下: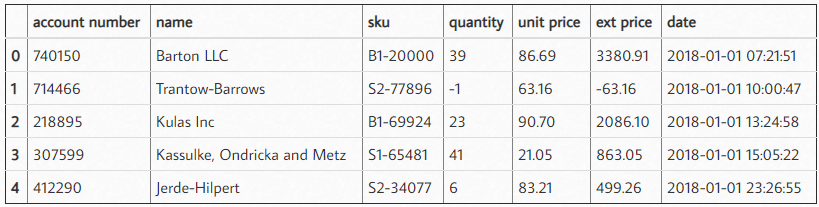 讀取這些數(shù)據(jù)后,我們可以做一個(gè)快速總結(jié),看看客戶從我們這里購買了多少以及他們的平均購買金額是多少。為了簡單起見,我這里截取了前 5 項(xiàng)數(shù)據(jù)。
df.groupby('name')['ext price'].agg(['mean', 'sum'])
結(jié)果如下:
2. 添加貨幣符號
當(dāng)您查看這些數(shù)據(jù)時(shí),理解數(shù)字的比例有點(diǎn)困難,因?yàn)槟?6 個(gè)小數(shù)點(diǎn)和一些較大的數(shù)字。此外,目前還不清楚這是美元還是其他貨幣。我們可以使用 DataFrame style.format 解決這個(gè)問題。
(df.groupby('name')['ext price']
 .agg(['mean', 'sum'])
 .style.format('${0:,.2f}'))
結(jié)果如下: 使用 format 函數(shù),可以在數(shù)據(jù)上使用 python 的字符串格式化工具的所有功能。在這種情況下,我們使用 ${0:,.2f} 放置前導(dǎo)美元符號,添加逗號并將結(jié)果四舍五入到小數(shù)點(diǎn)后兩位。
例如,如果我們想四舍五入到 0 位小數(shù),我們可以將格式更改為 ${0:,.0f}。
(df.groupby('name')['ext price']
 .agg(['mean', 'sum'])
 .style.format('${0:,.0f}'))
結(jié)果如下:
3. 添加百分比
如果我們想按月查看總銷售額,我們可以使用 grouper 按月匯總,并計(jì)算每個(gè)月占年總銷售額的百分比。
monthly_sales = df.groupby([pd.Grouper(key='date', freq='M')])['ext price'].agg(['sum']).reset_index()
monthly_sales['pct_of_total'] = monthly_sales['sum'] / df['ext price'].sum()
結(jié)果如下: 為了更加清楚明白的展示這個(gè)百分比,我們最好將其轉(zhuǎn)換為百分?jǐn)?shù)。
format_dict = {'sum':'${0:,.0f}', 'date': '{:%m-%Y}', 'pct_of_total': '{:.2%}'}
monthly_sales.style.format(format_dict).hide_index()
結(jié)果如下:
4. 突出顯示數(shù)字
除了樣式化數(shù)字,我們還可以設(shè)置 DataFrame 中的單元格樣式。讓我們用綠色突出顯示最高的數(shù)字,用彩色突出顯示最高、最低的數(shù)字。
(monthly_sales
 .style
 .format(format_dict)
 .hide_index()
 .highlight_max(color='lightgreen')
 .highlight_min(color='#cd4f39'))
結(jié)果如下:
5. 設(shè)置漸變色
另一個(gè)有用的函數(shù)是 background_gradient,它可以突出顯示列中的值范圍。
(monthly_sales.style
 .format(format_dict)
 .background_gradient(subset=['sum'], cmap='BuGn'))
結(jié)果如下:
6. 設(shè)置數(shù)據(jù)條
pandas樣式功能還支持在列內(nèi)繪制條形圖。
(monthly_sales
 .style
 .format(format_dict)
 .hide_index()
 .bar(color='#FFA07A', vmin=100_000, subset=['sum'], align='zero')
 .bar(color='lightgreen', vmin=0, subset=['pct_of_total'], align='zero')
 .set_caption('2018 Sales Performance'))
結(jié)果如下:
7. 繪制迷你圖
我認(rèn)為這是一個(gè)很酷的功能。
import sparklines

def sparkline_str(x):
    bins=np.histogram(x)[0]
    sl = ''.join(sparklines(bins))
    return sl

sparkline_str.__name__ = "sparkline"
df.groupby('name')['quantity', 'ext price'].agg(['mean', sparkline_str])
-
數(shù)據(jù)分析
+關(guān)注
關(guān)注
2文章
1473瀏覽量
35039 -
python
+關(guān)注
關(guān)注
56文章
4827瀏覽量
86747
發(fā)布評論請先 登錄
數(shù)據(jù)分析中最常用、最好用的20個(gè)Python庫分享
python數(shù)據(jù)分析的類庫
怎么有效學(xué)習(xí)Python數(shù)據(jù)分析?
成為Python數(shù)據(jù)分析師,需要掌握哪些技能
成為Python數(shù)據(jù)分析師,需要掌握哪些技能
如何去使用pandas工具
機(jī)器學(xué)習(xí)開發(fā)課程,使用Pandas探索數(shù)據(jù)分析
12種用于數(shù)據(jù)分析的Pandas技巧可用來學(xué)習(xí)Python詳細(xì)概述
pandas的快速入門介紹

Python工具pandas篩選數(shù)據(jù)的15個(gè)常用技巧
從Excel到Python數(shù)據(jù)分析進(jìn)階指南資源下載

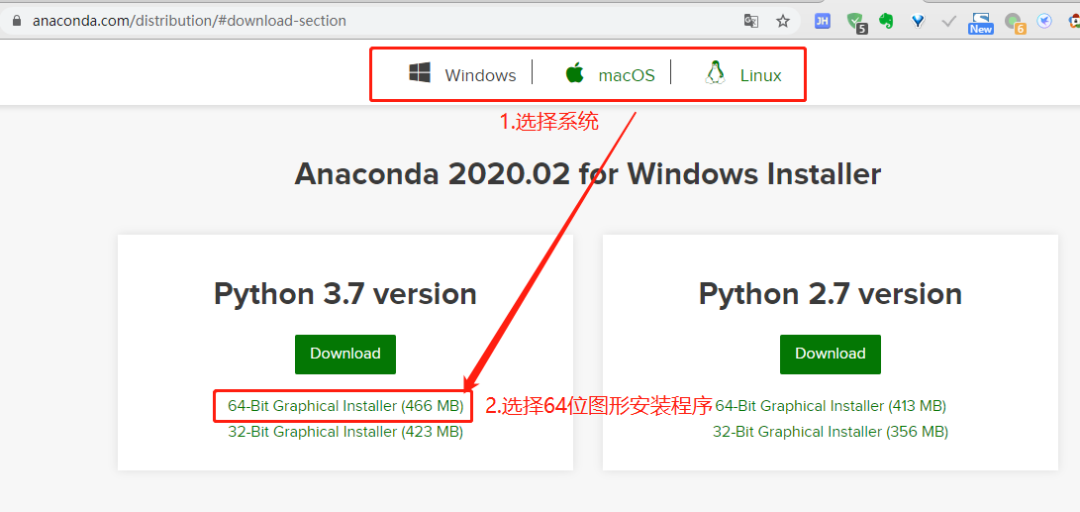
Anaconda:Python 數(shù)據(jù)分析與挖掘好幫手


 工商網(wǎng)監(jiān)
評論