") 使用TRACE_EVENT定義tracepoint的方式
使用TRACE_EVENT定義tracepoint的方式
內(nèi)核的各個(gè)子系統(tǒng)已經(jīng)有大量的跟蹤點(diǎn),如果這些跟蹤點(diǎn)無(wú)法滿足工作中的需求,可以自己手動(dòng)添加跟蹤點(diǎn)。
添加跟蹤點(diǎn)有兩種方式,一種是仿照events/目錄下的跟蹤點(diǎn),使用TRACE_EVENT() 宏添加。另一種是參考內(nèi)核目錄samples/trace_events添加。本文對(duì)這兩種方式分別進(jìn)行介紹。
使用 TRACE_EVENT 定義 tracepoint
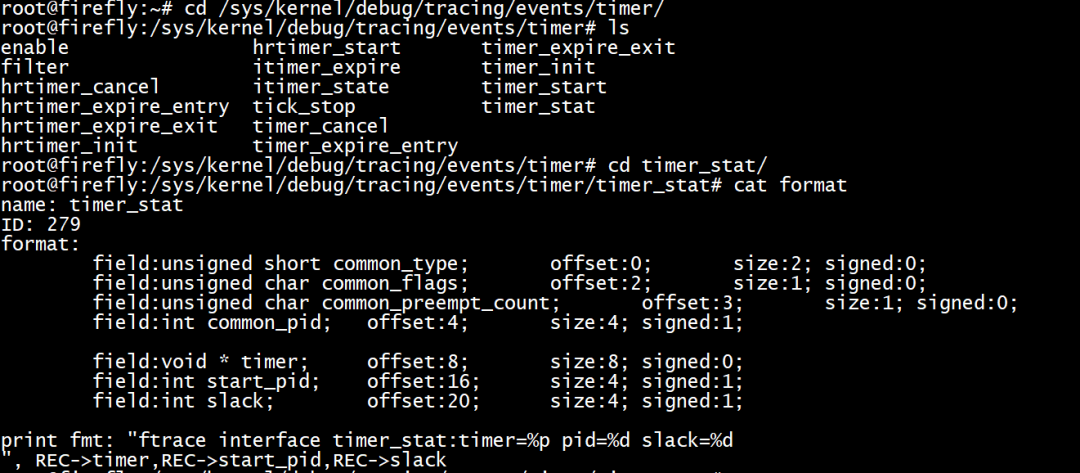
我們仿照events/timer/timer_start,添加一個(gè)timer_stat的跟蹤點(diǎn),獲取start_pid和slack參數(shù)。
首先,需要在include/trace/events/timer.h頭文件種添加名為timer_stat的跟蹤點(diǎn)。
/**
*timer_stat-ftraceinterfacetimer_stat
*@timer:pointertostructtimer_list
*/
TRACE_EVENT(timer_stat,

TP_PROTO(structtimer_list*timer),

TP_ARGS(timer),

TP_STRUCT__entry(
__field(void*,timer)
__field(int,start_pid)
__field(int,slack)
),

TP_fast_assign(
__entry->timer=timer;
__entry->start_pid=timer->start_pid;
__entry->slack=timer->slack;
),

TP_printk("ftraceinterfacetimer_stat:timer=%ppid=%dslack=%d
",
__entry->timer,__entry->start_pid,__entry->slack)
);
TRACE_EVENT()宏如下
#defineTRACE_EVENT(name,proto,args,struct,assign,print)
DEFINE_TRACE(name)
name:表示跟蹤點(diǎn)的名字,如上面的timer_stat。
proto:表示跟蹤點(diǎn)調(diào)用的入?yún)⒌脑停热鐃imer類型為struct timer_list *。
args:表示參數(shù)。
struct:定義跟蹤器內(nèi)部使用的__entry數(shù)據(jù)結(jié)構(gòu)。
assign:把參數(shù)復(fù)制到__entry數(shù)據(jù)結(jié)構(gòu)中。
print:定義輸出的格式。
接著在kernel/kernel/time/timer.c debug_activate()添加trace_timer_stat()。
staticinlinevoid
debug_activate(structtimer_list*timer,unsignedlongexpires)
{
debug_timer_activate(timer);
trace_timer_start(timer,expires,timer->flags);
trace_timer_stat(timer);
}
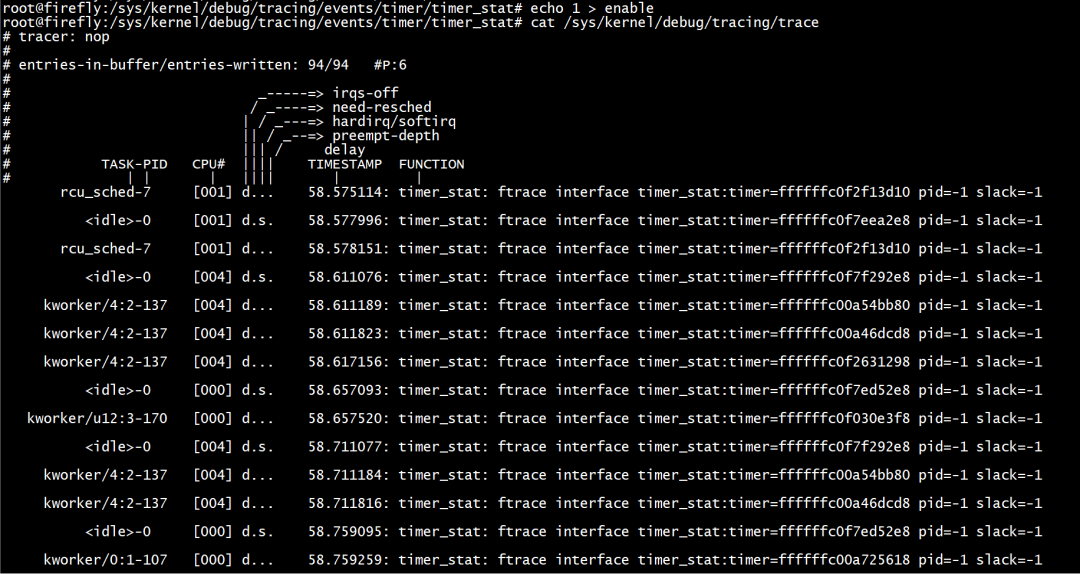
重新編譯內(nèi)核后,燒寫到設(shè)備中,即可看到sys節(jié)點(diǎn)已經(jīng)有了新增的跟蹤點(diǎn)。
使能跟蹤點(diǎn)后,查看trace點(diǎn)的輸出。
編譯為獨(dú)立的ko文件
內(nèi)核還提供了一個(gè)跟蹤點(diǎn)的例子,在samples/trace_events 目錄下。
trace_event_init()創(chuàng)建內(nèi)核線程一個(gè)名為event-sample內(nèi)核線程。
staticint__inittrace_event_init(void)
{
simple_tsk=kthread_run(simple_thread,NULL,"event-sample");
if(IS_ERR(simple_tsk))
return-1;

return0;
}
kthread_should_stop()用于創(chuàng)建的線程檢查結(jié)束標(biāo)志,并決定是否退出。
staticintsimple_thread(void*arg)
{
intcnt=0;

while(!kthread_should_stop())
simple_thread_func(cnt++);

return0;
}
set_current_state() 來設(shè)置進(jìn)程的狀態(tài),設(shè)置為TASK_INTERRUPTIBLE表示是可以被信號(hào)和wake_up()喚醒的,當(dāng)信號(hào)到來時(shí),進(jìn)程會(huì)被設(shè)置為可運(yùn)行。
schedule_timeout()將當(dāng)前task調(diào)度出cpu,重新調(diào)度間隔為HZ。接著trace_開頭的函數(shù)就會(huì)依次打印跟蹤點(diǎn)的信息。
staticvoidsimple_thread_func(intcnt)
{
intarray[6];
intlen=cnt%5;
inti;
set_current_state(TASK_INTERRUPTIBLE);
schedule_timeout(HZ);
for(i=0;i
trace_foo_with_template_simple跟蹤點(diǎn)的實(shí)現(xiàn)方式也是使用的TRACE_EVENT ()宏,這里不再贅述。
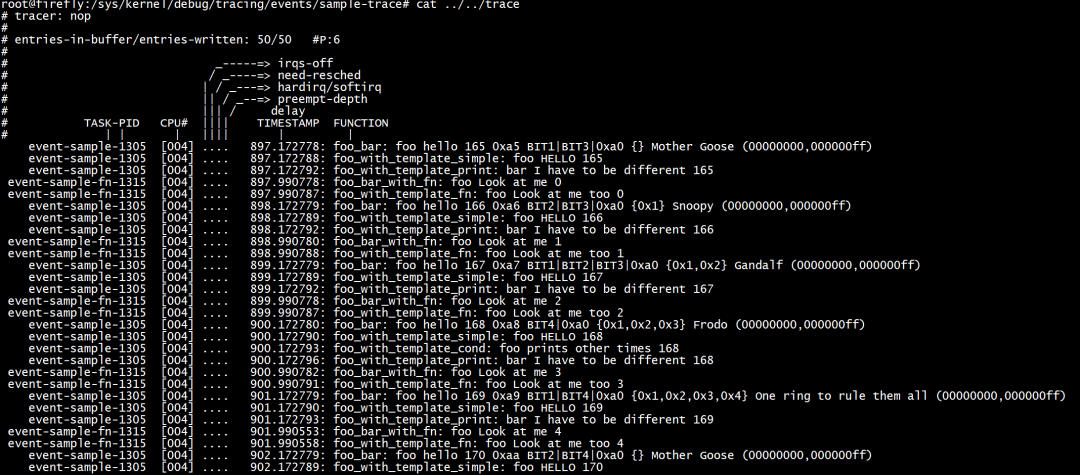
最后將文件編譯為ko拷貝到設(shè)備上insmod后,即可看到sys目錄下已經(jīng)有新增的節(jié)點(diǎn)。
cd/home/zhongyi/code/rk3399_linux_release_v2.5.1_20210301/kernel/samples/trace_events
make-C/home/zhongyi/code/rk3399_linux_release_v2.5.1_20210301/kernel/M=$(pwd)modules
root@firefly:/sys/kernel/debug/tracing#catavailable_events|grepsample
sample-trace:foo_bar
sample-trace:foo_bar_with_cond
race:foo_bar_with_fn
sample-trace:foo_with_template_simple
sample-trace:foo_with_template_cond
sample-trace:foo_with_template_fn
sample-trace:foo_with_template_print
power:pstate_sample
root@firefly:/sys/kernel/debug/tracing#cdevents/sample-trace/
root@firefly:/sys/kernel/debug/tracing/events/sample-trace#ls
enablefoo_bar_with_condfoo_with_template_fn
filterfoo_bar_with_fnfoo_with_template_print
foo_barfoo_with_template_condfoo_with_templ_simple
root@firefly:/sys/kernel/debug/tracing/events/sample-trace#echo1>enable
root@firefly:/sys/kernel/debug/tracing/events/sample-trace#cat/sys/kernel/debug/tracing/trace
TRACE_EVENT_CONDITION()
在某些情況下,跟蹤點(diǎn)只有在某個(gè)條件發(fā)生時(shí)才會(huì)被調(diào)用,類似于
if(cond)
trace_foo();
TRACE_EVENT_CONDITION()宏就是這個(gè)作用,它和TRACE_EVENT()相比只是在參數(shù)中多加了一個(gè)cond條件。TP_CONDITION()會(huì)對(duì)條件做個(gè)判斷。
TRACE_EVENT(name,proto,args,struct,assign,printk)
TRACE_EVENT_CONDITION(name,proto,args,cond,struct,assign,printk)
詳細(xì)使用方法可以參考trace-events-sample.h。
TRACE_EVENT_FN()
TRACE_EVENT_FN()是在跟蹤點(diǎn)使能前和使能后分別打印一些信息。相比于TRACE_EVENT(),TRACE_EVENT_FN()多了兩個(gè)參數(shù)reg和unreg,
TRACE_EVENT(name,proto,args,struct,assign,printk)
TRACE_EVENT_FN(name,proto,args,struct,assign,printk,reg,unreg)
reg 和unreg原型為
voidreg(void)
reg函數(shù)在跟蹤點(diǎn)使能前打印,unreg函數(shù)在跟蹤點(diǎn)使能后打印。reg 和unreg可以根據(jù)實(shí)際情況置其中一個(gè)為NULL,也可以全部置為NULL。
詳細(xì)使用方法可以參考trace-events-sample.h。
審核編輯:劉清
-
cpu
+關(guān)注
關(guān)注
68文章
11029瀏覽量
215873 -
Trace
+關(guān)注
關(guān)注
0文章
19瀏覽量
10715 -
跟蹤器
+關(guān)注
關(guān)注
0文章
132瀏覽量
20359
原文標(biāo)題:ftrace(二)新增tracepoint
文章出處:【微信號(hào):嵌入式與Linux那些事,微信公眾號(hào):嵌入式與Linux那些事】歡迎添加關(guān)注!文章轉(zhuǎn)載請(qǐng)注明出處。
發(fā)布評(píng)論請(qǐng)先 登錄
怎樣通過trace生成系統(tǒng)cpu的loading圖
heap_trace_init_tohost 的 sysviewtrace_proc解析錯(cuò)誤如何解決?
Trace thickness
TRACE32多核策略
利用tracepoint梳理調(diào)度器框架及主要流程
勞特巴赫trace32使用介紹(一)

ThreadX(四)------TraceX使用
Systemverilog event的示例
Ftrace使用tracefs文件系統(tǒng)保存控制文件
Trace功能的添加、組態(tài)及測(cè)試
Linux ftrace工具宏定義
如何對(duì)基于μTrace和Trace32的LPC86x進(jìn)行邊界掃描


 工商網(wǎng)監(jiān)
評(píng)論