") perf 在內(nèi)核中的實現(xiàn)原理
perf 在內(nèi)核中的實現(xiàn)原理

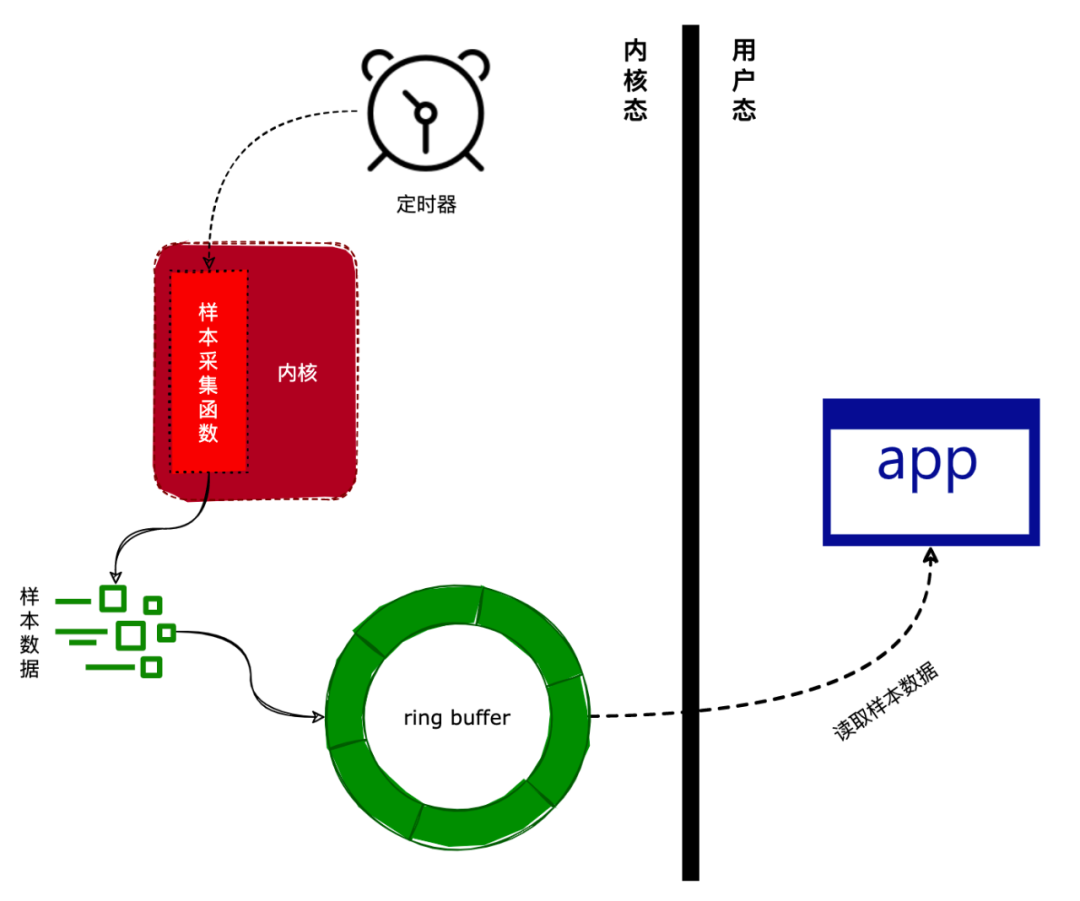
我們在《一文看懂Linux性能分析|perf 原理》一文中介紹過,perf 是基于采樣來對程序進行分析的。采樣的步驟如下:
通過設(shè)置一個定時器,定時器的觸發(fā)時間可以由用戶設(shè)定。
定時器被觸發(fā)后,將會調(diào)用采集函數(shù)收集當前運行環(huán)境的數(shù)據(jù)(如當前正在執(zhí)行的進程和函數(shù)等)。
將采集到的數(shù)據(jù)寫入到一個環(huán)形緩沖區(qū)(ring buffer)中。
應(yīng)用層可以通過內(nèi)存映射來讀取環(huán)形緩沖區(qū)中的采樣數(shù)據(jù)。
上述步驟如下圖所示:
接下來,我們將會介紹 perf 在 Linux 內(nèi)核中的實現(xiàn)。
事件
perf 是基于事件進行采樣的,上面所說的定時器就是其中一種事件,被稱為:CPU時鐘事件。除了 CPU 時鐘事件外,perf 還支持多種事件,如:
上下文切換事件:當調(diào)度器切換進程時觸發(fā)。
缺頁異常事件:當進程訪問還沒有映射到物理內(nèi)存的虛擬內(nèi)存地址時觸發(fā)。
CPU遷移事件:當進程從一個 CPU 遷移到另一個 CPU 時觸發(fā)。
...
由于 perf 支持的事件眾多,所以本文只挑選CPU時鐘事件進行分析。
1. perf_event 結(jié)構(gòu)體
Linux 內(nèi)核使用perf_event結(jié)構(gòu)體來描述一個事件(如 CPU 時鐘事件),其定義如下(由于 perf_event 結(jié)構(gòu)體過于龐大,所以對其進行簡化):
structperf_event{
...
structlist_headevent_entry;
conststructpmu*pmu;
enumperf_event_active_statestate;
atomic64_tcount;//事件被觸發(fā)的次數(shù)
...
structperf_event_attrattr;//事件的屬性(由用戶提供)
structhw_perf_eventhw;
structperf_event_context*ctx;//事件所屬的上下文
...
};
我們現(xiàn)在只需關(guān)注其中的兩個成員變量:count和ctx。
count:表示事件被觸發(fā)的次數(shù)。
ctx:表示當前事件所屬的上下文。
count成員變量容易理解,所以就不作詳細介紹了。我們注意到 ctx 成員變量的類型為perf_event_context結(jié)構(gòu),那么這個結(jié)構(gòu)代表什么?
2. perf_event_context 結(jié)構(gòu)體
因為一個進程可以同時分析多種事件,所以就使用perf_event_context結(jié)構(gòu)來記錄屬于進程的所有事件。我們來看看perf_event_context結(jié)構(gòu)的定義,如下所示:
structperf_event_context{
...
structlist_headevent_list;//連接所有屬于當前上下文的事件
intnr_events;//屬于當前上下文的所有事件的總數(shù)
...
structtask_struct*task;//當前上下文屬于的進程
...
};
我們對perf_event_context結(jié)構(gòu)進行了簡化,下面介紹一下各個成員的作用:
event_list:連接所有屬于當前上下文的事件。
nr_events:屬于當前上下文的所有事件的總數(shù)。
task:當前上下文所屬的進程。
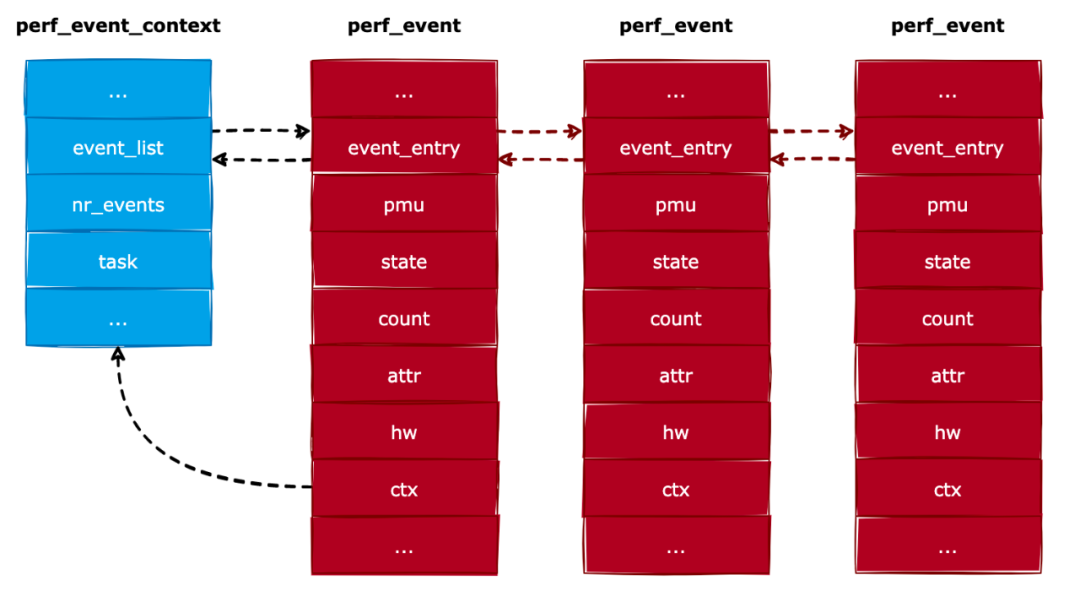
perf_event_context結(jié)構(gòu)通過event_list字段把所有屬于本上下文的事件連接起來,如下圖所示:
另外,在進程描述結(jié)構(gòu)體task_struct中,有個指向perf_event_context結(jié)構(gòu)的指針。如下所示:
structtask_struct{
...
structperf_event_context*perf_event_ctxp;
...
};
這樣,內(nèi)核就能通過進程描述結(jié)構(gòu)體的perf_event_ctxp成員,來獲取屬于此進程的事件列表。
3. pmu 結(jié)構(gòu)體
前面我們說過 perf 支持多種事件,而不同的事件應(yīng)該有不同的啟用和禁用動作。為了讓不同的事件有不同的啟用和禁用動作,所以內(nèi)核定義了pmu結(jié)構(gòu)。其定義如下:
structpmu{
int(*enable)(structperf_event*event);
void(*disable)(structperf_event*event);
void(*read)(structperf_event*event);
...
};
下面介紹一下各個字段的作用:
enable:啟用事件。
disable:禁用事件。
read:事件被觸發(fā)時的回調(diào)。
perf_event結(jié)構(gòu)的pmu成員是一個指向pmu結(jié)構(gòu)的指針。如果當前事件是個 CPU 時鐘事件時,pmu成員將會指向perf_ops_cpu_clock變量。
我們來看看perf_ops_cpu_clock變量的定義:
staticconststructpmuperf_ops_cpu_clock={
.enable=cpu_clock_perf_event_enable,
.disable=cpu_clock_perf_event_disable,
.read=cpu_clock_perf_event_read,
};
也就是說:
當要啟用一個 CPU 時鐘事件時,內(nèi)核將會調(diào)用cpu_clock_perf_event_enable()函數(shù)來啟用這個事件。
當要禁用一個 CPU 時鐘事件時,內(nèi)核將會調(diào)用cpu_clock_perf_event_disable()函數(shù)來禁用這個事件。
當事件被觸發(fā)時,內(nèi)核將會調(diào)用cpu_clock_perf_event_read()函數(shù)來進行特定的動作。
啟用事件
前面說過,當要啟用一個 CPU 時鐘事件時,內(nèi)核會調(diào)用cpu_clock_perf_event_enable()函數(shù)來啟用它。我們來看看cpu_clock_perf_event_enable()函數(shù)的實現(xiàn),代碼如下:
staticint
cpu_clock_perf_event_enable(structperf_event*event)
{
...
perf_swevent_start_hrtimer(event);

return0;
}
從上面代碼可以看出,cpu_clock_perf_event_enable()函數(shù)實際上調(diào)用了perf_swevent_start_hrtimer()函數(shù)來進行初始化工作。我們再來看看perf_swevent_start_hrtimer()函數(shù)的實現(xiàn):
staticvoid
perf_swevent_start_hrtimer(structperf_event*event)
{
structhw_perf_event*hwc=&event->hw;

// 1. 初始化一個定時器,定時器的回調(diào)函數(shù)為:perf_swevent_hrtimer()
hrtimer_init(&hwc->hrtimer,CLOCK_MONOTONIC,HRTIMER_MODE_REL);
hwc->hrtimer.function=perf_swevent_hrtimer;

if(hwc->sample_period){
...

//2.啟動定時器
__hrtimer_start_range_ns(&hwc->hrtimer,ns_to_ktime(period),0,
HRTIMER_MODE_REL,0);
}
}
從上面的代碼可知,perf_swevent_start_hrtimer()函數(shù)主要完成兩件事情:
初始化一個定時器,定時器的回調(diào)函數(shù)為:perf_swevent_hrtimer()。
啟動定時器。
這個定時器結(jié)構(gòu)保存在perf_event結(jié)構(gòu)的hwc成員中,我們在以后的文章中將會介紹 Linux 高精度定時器的實現(xiàn)。
當定時器被觸發(fā)時,內(nèi)核將會調(diào)用perf_swevent_hrtimer()函數(shù)來處理事件。我們再來分析一下perf_swevent_hrtimer()函數(shù)的實現(xiàn):
staticenumhrtimer_restart
perf_swevent_hrtimer(structhrtimer*hrtimer)
{
enumhrtimer_restartret=HRTIMER_RESTART;
structperf_sample_datadata;
structpt_regs*regs;
structperf_event*event;
u64period;

//獲取當前定時器所屬的事件對象
event=container_of(hrtimer,structperf_event,hw.hrtimer);

//前面說過,如果是CPU時鐘事件,將會調(diào)用cpu_clock_perf_event_read()函數(shù)
event->pmu->read(event);

data.addr=0;
//獲取定時器被觸發(fā)時所有寄存器的值
regs=get_irq_regs();

...
if(regs){
if(!(event->attr.exclude_idle&¤t->pid==0)){
//最重要的地方:對數(shù)據(jù)進行采樣
if(perf_event_overflow(event,0,&data,regs))
ret=HRTIMER_NORESTART;
}
}
...
returnret;
}
perf_swevent_hrtimer()函數(shù)最重要的操作就是:調(diào)用perf_event_overflow()函數(shù)對數(shù)據(jù)進行采樣與收集。perf_event_overflow()函數(shù)在后面將會介紹,我們暫時跳過。
那什么時候會啟用事件呢?答案就是:進程被調(diào)度到 CPU 運行時。調(diào)用鏈如下:
schedule()
└→ context_switch()
└→ finish_task_switch()
└→ perf_event_task_sched_in()
└→ __perf_event_sched_in()
└→ group_sched_in()
└→ event_sched_in()
└→ event->pmu->enable()
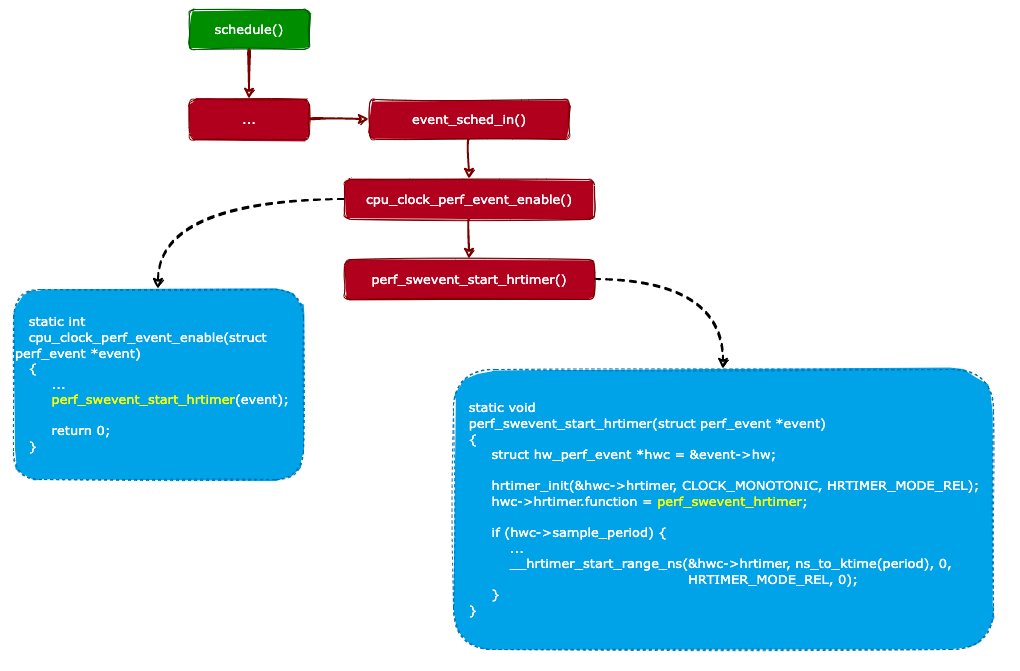
└→ cpu_clock_perf_event_enable()
內(nèi)核通過調(diào)用schedule()函數(shù)來完成調(diào)度工作。從上面的調(diào)用鏈可知,當進程選中被調(diào)度到 CPU 運行時,最終會調(diào)用cpu_clock_perf_event_enable()函數(shù)來啟用這個 CPU 時鐘事件。
啟用事件的過程如下圖所示:
所以,當進程被選中并且被調(diào)度運行時,內(nèi)核會啟用屬于此進程的 perf 事件。不難看出,當進程被調(diào)度出 CPU 時(停止運行),內(nèi)核會禁用屬于此進程的 perf 事件。
數(shù)據(jù)采樣
最后,我們來看看 perf 是怎么進行數(shù)據(jù)采樣的。
通過上面的分析,我們知道 perf 最終會調(diào)用perf_event_overflow()函數(shù)來進行數(shù)據(jù)采樣。所以我們來看看perf_event_overflow()函數(shù)的實現(xiàn),代碼如下:
int
perf_event_overflow(structperf_event*event,intnmi,
structperf_sample_data*data,
structpt_regs*regs)
{
return__perf_event_overflow(event,nmi,1,data,regs);
}
可以看出,perf_event_overflow()函數(shù)只是對__perf_event_overflow()函數(shù)的封裝。我們接著來分析__perf_event_overflow()函數(shù)的實現(xiàn):
staticint
__perf_event_overflow(structperf_event*event,intnmi,intthrottle,
structperf_sample_data*data,structpt_regs*regs)
{
...
perf_event_output(event,nmi,data,regs);

returnret;
}
從上面代碼可知,__perf_event_overflow()會調(diào)用perf_event_output()函數(shù)來進行數(shù)據(jù)采樣。perf_event_output()函數(shù)的實現(xiàn)如下:
staticvoid
perf_event_output(structperf_event*event,intnmi,
structperf_sample_data*data,
structpt_regs*regs)
{
structperf_output_handlehandle;
structperf_event_headerheader;

//進行數(shù)據(jù)采樣,并且把采樣到的數(shù)據(jù)保存到data變量中
perf_prepare_sample(&header,data,event,regs);
...

//把采樣到的數(shù)據(jù)保存到環(huán)形緩沖區(qū)中
perf_output_sample(&handle,&header,data,event);
...
}
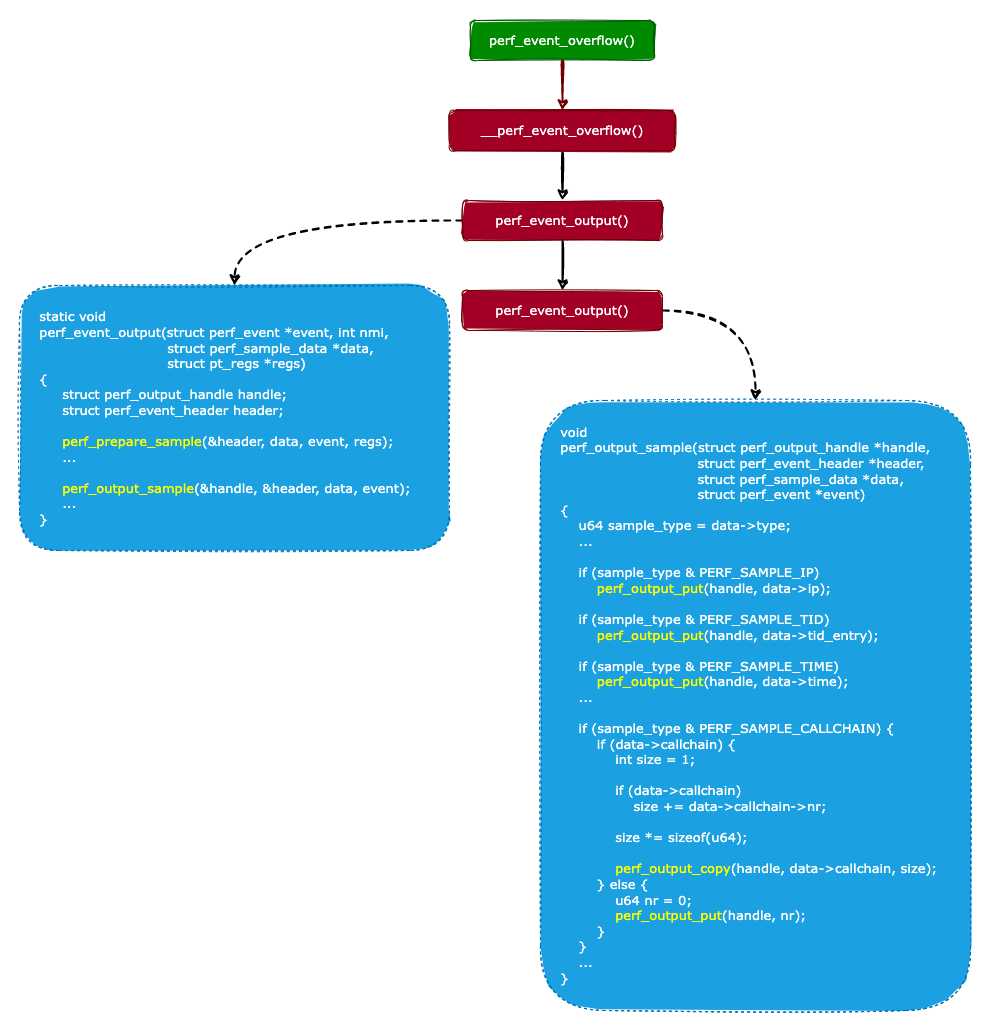
perf_event_output()函數(shù)會進行兩個操作:
調(diào)用perf_prepare_sample()函數(shù)進行數(shù)據(jù)采樣,并且把采樣到的數(shù)據(jù)保存到 data 變量中。
調(diào)用perf_output_sample()函數(shù)把采樣到的數(shù)據(jù)保存到環(huán)形緩沖區(qū)中。
我們來看看 perf 是怎么把采樣到的數(shù)據(jù)保存到環(huán)形緩沖區(qū)的:
void
perf_output_sample(structperf_output_handle*handle,
structperf_event_header*header,
structperf_sample_data*data,
structperf_event*event)
{
u64sample_type=data->type;
...

//1.保存當前IP寄存器地址(用于獲取正在執(zhí)行的函數(shù))
if(sample_type&PERF_SAMPLE_IP)
perf_output_put(handle,data->ip);

//2.保存當前進程ID
if(sample_type&PERF_SAMPLE_TID)
perf_output_put(handle,data->tid_entry);

//3.保存當前時間
if(sample_type&PERF_SAMPLE_TIME)
perf_output_put(handle,data->time);
...

//n.保存函數(shù)的調(diào)用鏈
if(sample_type&PERF_SAMPLE_CALLCHAIN){
if(data->callchain){
intsize=1;

if(data->callchain)
size+=data->callchain->nr;

size*=sizeof(u64);

perf_output_copy(handle,data->callchain,size);
}else{
u64nr=0;
perf_output_put(handle,nr);
}
}
...
}
perf_output_sample()通過調(diào)用perf_output_put()函數(shù)把用戶感興趣的數(shù)據(jù)保存到環(huán)形緩沖區(qū)中。
用戶感興趣的數(shù)據(jù)是在創(chuàng)建事件時指定的,例如,如果我們對函數(shù)的調(diào)用鏈感興趣,那么可以在創(chuàng)建事件時指定PERF_SAMPLE_CALLCHAIN標志位。
perf 事件可以通過pref_event_open()系統(tǒng)調(diào)用來創(chuàng)建,關(guān)于pref_event_open()系統(tǒng)調(diào)用的使用,讀者可以自行參考相關(guān)的資料。
當 perf 把采樣的數(shù)據(jù)保存到環(huán)形緩沖區(qū)后,用戶就可以通過mmap()系統(tǒng)調(diào)用把環(huán)形緩沖區(qū)的數(shù)據(jù)映射到用戶態(tài)的虛擬內(nèi)存地址來進行讀取。由于本文只關(guān)心數(shù)據(jù)采樣部分,所以 perf 的其他實現(xiàn)細節(jié)可以參考 perf 的源代碼。
數(shù)據(jù)采樣的流程如下圖所示:
總結(jié)
本文主要介紹了 perf 的 CPU 時鐘事件的實現(xiàn)原理,另外 perf 除了需要內(nèi)核支持外,還需要用戶態(tài)應(yīng)用程序支持,例如:把采樣到的原始數(shù)據(jù)生成可視化的數(shù)據(jù)或者使用圖形化表現(xiàn)出來。
當然,本文主要是介紹 perf 在內(nèi)核中的實現(xiàn),用戶態(tài)的程序可以參考 Linux 源碼tools/perf目錄下的源代碼。
當然,perf 是非常復(fù)雜的,本文也忽略了很多細節(jié)(如果把所有細節(jié)都闡明,那么篇幅將會非常長),所以讀者如果有什么疑問也可以留言討論。
-
內(nèi)核
+關(guān)注
關(guān)注
3文章
1416瀏覽量
41443 -
數(shù)據(jù)
+關(guān)注
關(guān)注
8文章
7256瀏覽量
91890 -
時鐘
+關(guān)注
關(guān)注
11文章
1901瀏覽量
133241 -
代碼
+關(guān)注
關(guān)注
30文章
4900瀏覽量
70754
原文標題:一文看懂 Linux 性能分析|perf 源碼實現(xiàn)
文章出處:【微信號:LinuxDev,微信公眾號:Linux閱碼場】歡迎添加關(guān)注!文章轉(zhuǎn)載請注明出處。
發(fā)布評論請先 登錄
全球最高性能RISC-V處理器的Perf性能分析工具發(fā)布

一文詳解Linux的perf_event
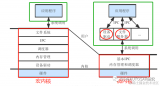
微內(nèi)核中的電源管理
全志Tina中使用perf分析CPU使用率
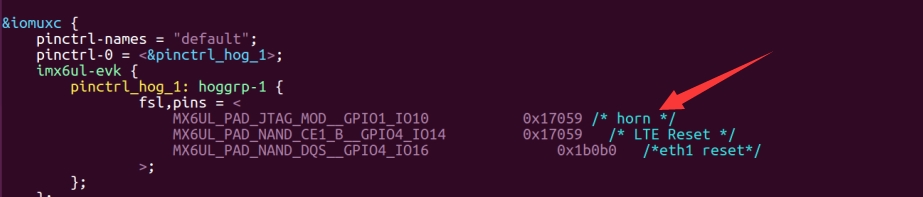
I.MX8MM開發(fā)板Linux如何在內(nèi)核中添加驅(qū)動呢
你知道perf學習-linux自帶性能分析工具怎么用?
米爾科技改內(nèi)核調(diào)整GPIO在內(nèi)核啟動階段方案
Coolbpf 在perf 事件中的增強
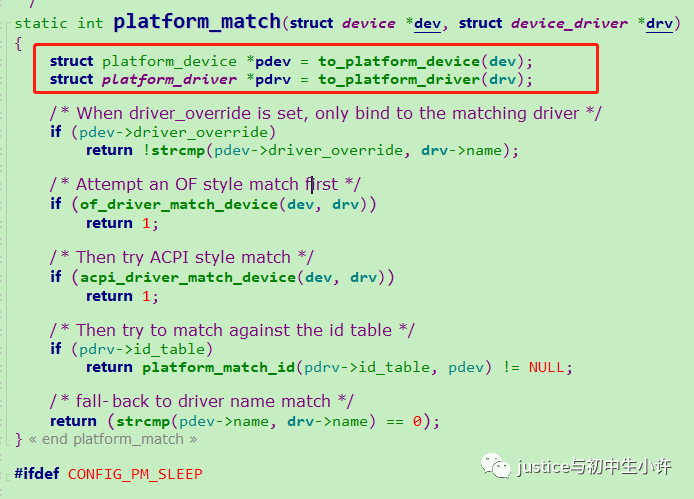
解構(gòu)內(nèi)核 perf 框架的實現(xiàn)講解
萬字長文解讀Linux內(nèi)核追蹤機制
Linux內(nèi)核中的宏/container_of分析
Linux perf性能、實際應(yīng)用與案例
如何使用perf性能分析工具
Linux perf 簡要介紹
如何在內(nèi)核中啟動secondary cpu


 工商網(wǎng)監(jiān)
評論